Data analytics
ETLData cleaningExploratory data analysisData validationData quality auditingKPI reporting
Data Analyst
I analyse complex data and build decision-ready dashboards. A background in mathematics and years of tutoring experience help me explain findings in a way anyone can follow.

Ibrahim Adeyemi Yusuf
Quantitative thinking. Clear communication.
About
I am a data analyst with a strong quantitative foundation, grounded in a B.Sc. (Ed.) in Mathematics Education.
My work centres on data cleaning, validation, modeling, KPI reporting, and decision-ready dashboards built with Power BI, SQL, Python, and Excel.
Years of mathematics tutoring taught me to break complex ideas down step by step — the same skill I use to explain dashboards and findings to non-technical audiences.
SQL, Power BI, Excel, Python, data cleaning, modeling, validation, and business intelligence reporting.
Explaining dashboards and analysis to non-technical audiences — a strength built through years of mathematics tutoring.
Capabilities
Built through portfolio work, enterprise-scale simulations, and hands-on practice.
Selected work
End-to-end work spanning data preparation, calculation logic, and interactive reporting.
CASE STUDY / 01
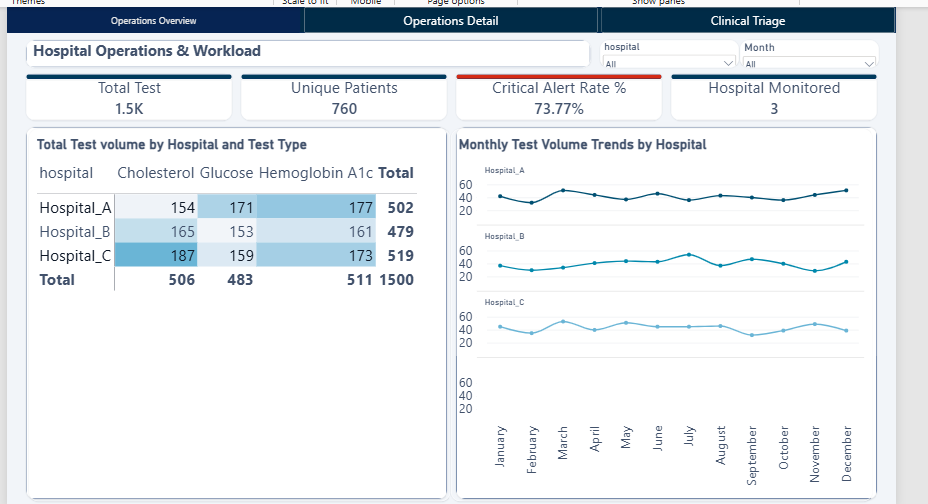
An end-to-end, four-page Power BI application built from 1,500 laboratory records across three hospitals and three test types. The work combined Python/Pandas and Power Query data cleaning with DAX-based clinical classification.
CASE STUDY / 02
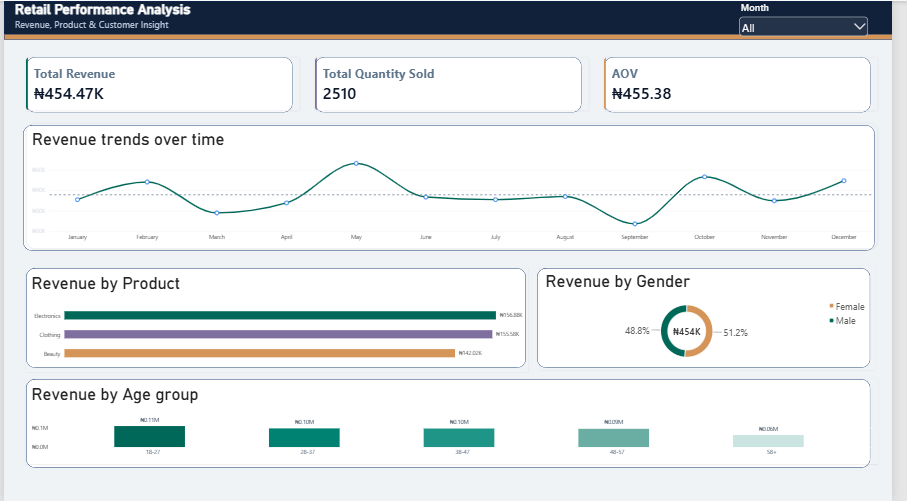
An interactive Power BI dashboard analysing 2023 retail performance across revenue, quantity sold, Average Order Value, product category, customer gender, age groups, and monthly sales trends.
More analytical work
Enterprise-scale simulations covering SQL scripts, Power Query transformations, Excel models, data auditing, and executive-ready reporting.
Experience
August 2026 – Present
Data Analytics Simulation Program — DataSimHQ
2019 – Present
Independent
Education & credentials
University of Lagos · Graduated 2024
Second Class Upper Division (2:1)
Relevant coursework: Statistics, Probability Theory, Numerical Analysis, Linear Algebra, and Quantitative Logic.
Data Analytics Simulation Program — DataSimHQ
Google Certified Educator — Level 1 & Level 2 (2026)
SQL & Python for Data Science — SoloLearn
Contact
I’m open to data analyst and business intelligence opportunities.